There are two software tools I use frequently, but I know I am barely utilizing them to their full potential. I get good information from them to analyze problems and validate solutions. However, I know there is an additional level of capability that I haven’t had a chance to explore.
The tools are both key to analyzing long-running tests, especially around SPI and I2C interfaces. This week I’ve been using one of them to investigate some issues on the USB bus, and I will need to use more of the tool’s capabilities. This morning, for the first time ever, I’m actually reading and browsing through the user manual.
So, what are these tools?
- Saleae
Logic2with- Logic Pro 16
- Total Phase
Data Centerwith- Beagle I2C/SPI
- Beagle USB480
- Komodo CAN Duo
Why I use them
These two tools are my go-to protocol analyzers. That is, I use them once I am happy with the electrical characteristics of the bus I am monitoring, and I want to see the packets on the bus are well formed.
Yes, I could use more elaborate and expensive equipment, but these two tool chains give a lot of information that I need in a familiar way (I’ve had Data Center for 20 years and Saleae for nine).
Data Center has the advantage over my MSO in its ability to log for a very long time. You can leave it running over the weekend, monitoring an I2C bus, and come back on Monday to the whole story. With my oscilloscope, I would set it up to capture discrete events of interest and have it save each capture to disk or email the results to me. You miss quite a bit of information that way, especially if you misconfigure a complex trigger.
An oscilloscope can decode packages on screen (with the right license or built in software), but that’s only one package at a time. Other long-term decodes are byte at a time.
The Beagle, with Data Center, will show packages, interpackage timing, errors, and much more. Normally, I can quickly spot what I need.
The Saleae can capture a long run as well. It will decode bytes on the SPI and I2C bus, but the built-in low-level analyzer in Logic2 does not assemble packages. I know, they also support High-Level Analyzers. I need to slow down and learn about them. The usual problem is that I either need it yesterday or my attention is focused on another project. Besides, to match Data Center capabilities, I’d have to write a fancy HLA. Is it worth the effort? Perhaps yes for quad SPI and faster SPI data rates, which are not supported by my trusty Beagle.
Today’s Learning
To debug what appears to be a missed transaction from our embedded controller to the host PC, I need to examine the timing of transactions on the USB bus. Since errors happen minutes apart in a 30-minute run, I have a lot of data to handle. Needles and haystacks.
But I know when it’s happening!
It should be easy to find an event that happened at “that time”. I’ve been given a UTC timestamp to match. Great. The listing in Data Center is showing relative time, from the start of capture, not the start of the experiment.
You might assume that the creation time of the log file matches the start time of capture. I know I did. Then I remembered that Data Center logs to RAM, and the file is not created until you export the data.
So now I know I need to find a long interval between captures. So I look at the filters available. Yes, there is duration filter, but that’s time taken for a packet transmission, not for interval between packets, never mind between packets of a certain type. Looks like I’ll have to export to a .csv file and use Excel to handle this.
Have you ever seen the timestamps in Data Center?
0:04.015.734Yup, that is <MINUTES>:<SECONDS>.<MILLISECONDS>.<MICROSECONDS>
I could probably convince Excel to convert that, or maybe SED could strip those extra periods.
But Excel is not happy. Have you seen how big a .csv file you get when you export 15 minutes of USB logs from Data Center? More than Excel wants in a sheet.
Time to RTFM (read the ‘user’ manual)
It’s a big book. And I didn’t know all the keywords I needed to search efficiently. Thankfully, I have enough domain-specific vocabulary to find what I needed. I also had explored various menus and controls, so I had targeted questions.
Firstly, rather than exporting to a .csv file and then using grep to search for the pertinent lines, I found that export could be limited to just save the search result rows. That would be very helpful for me in reducing the dataset size.
I only knew this was an option because the export function offered three cryptic options.
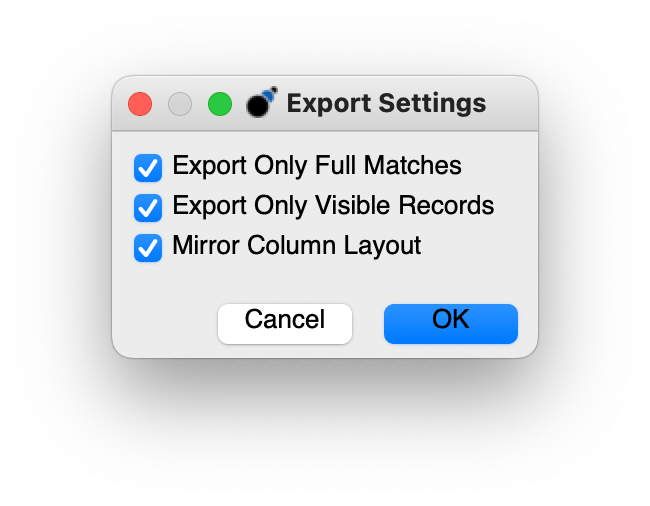
Only Full Matches was the option that sounded most helpful. But would this be search matches, filter matches, or both? The official answer, well:
Export Only Full Matches
If selected, only the records that are full matches will be exported. Any record that is a soft match (denoted by the faded color) will not be exported when this option is enabled.
I had to read further.
As for timestamps. The .csv file had mixed-format timestamps. I started to look for some definitions about the timestamp and found accidentally “wall time”!
1.7 Changes in version 6.53
- Added an option to export to binary.
- Added an option to display wall time in the timestamp column of the transaction log.
- Increased absolute maximum capture limit size to 32 GB.
This lead me to search for the only other instance of wall in the manual.
Another mode of operation which can be set in the context menu is Wall Time View. In this mode, the column displays the actual time and date that the transaction was captured. This time is calculated by adding the system time at the start of capture to the time counter shown in the default mode.
This paragraph was in the context of the Transaction Window. I tried right clicking on the timestamp column header, and saw no such option. Undaunted I right clicked in the transaction main view and there it was
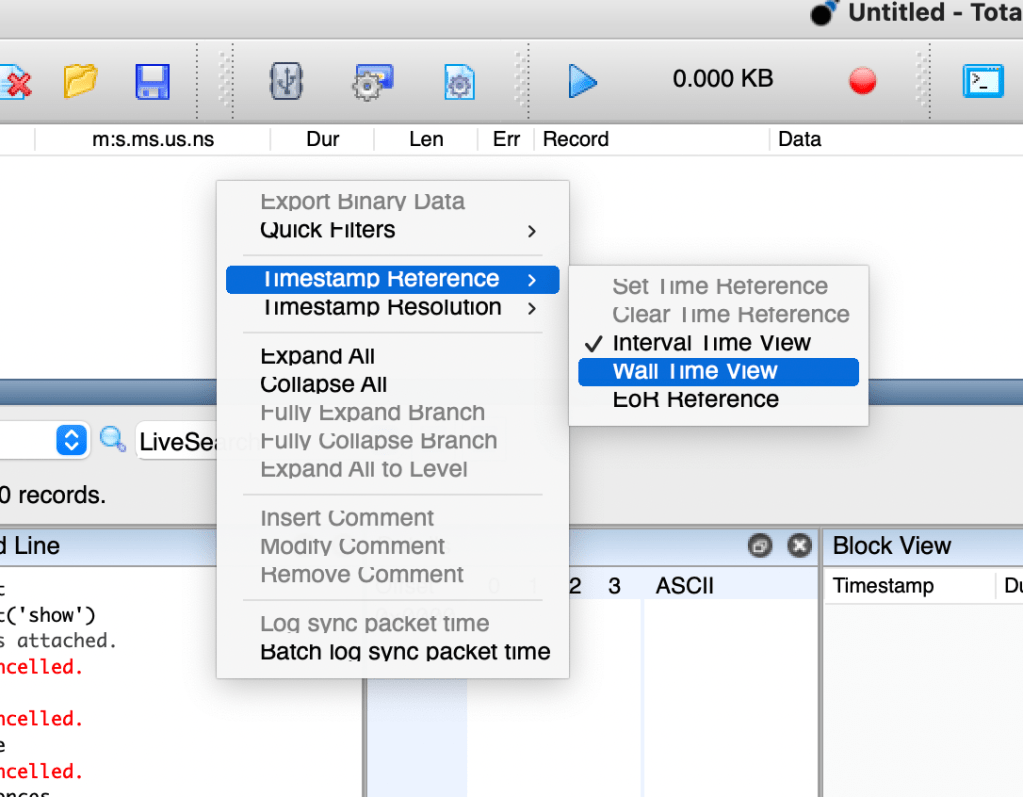
And yes, at my screen resolution, there really were a few rendering issues on a MacBook Pro.
When I get to the office, I’ll find out if wall time information can be recovered from a .tdc file or if I can only see wall time from the RAM buffer of a recent session.
Making Time to Save Time
In bigger companies, 10-20% of your time might be allocated to learning and training. In a start-up, we are always learning, and we are often under tight time schedules. I find that a personal trait in such times is only learning enough to get the job done. Everyone is looking for an answer right now, and I want to deliver as soon as possible. It takes a bit of discipline to make time to learn. It also requires you to get to a space without distractions.
In these days of no cubicles, there are too many distracting conversations going on. Sure, there is that instantaneous inclusion allowing me to learn and contribute, but this benefit is offset by the cost of context switches. It can take several minutes to regain my lost train of thought, and sometimes I forget how many parallel tasks I was actually working on.
I also find that when I have my computer in front of me, every time I learn something significant, I try to apply it, rather than read extended details. I’m the same when reviewing my own code. I’ll actually look at my PR on GitHub, rather than diff within my IDE or console. If I have the code editable right there, I examine each change in isolation, rather than as part of a bigger solution.
A few years ago, my sleep pattern changed. I am typically awake by 6am and get at least two hours of quiet time at home before I leave for work. I also no longer have a home office, which means I can’t get distracted by doing. I now have a time/context when I can focus on learning without distraction.
When I take the time to learn, plan my code, or review it offline (I used to love marking up printed listings and still review text on paper), I do a better job with fewer missteps. I also find it very hard to step away from a crisis in the project; high availability seems to be a premium, and I allow that to distract me. I must finally be growing up, or becoming more confident, as I am now more likely to push back against rushed work. I still don’t do it as often as I should.
Conclusion
Slowing down to learn your tools is critical. You don’t have to learn every nuanced use case. You can learn just-in-time, but learn properly, don’t just skim. It took me an hour or so today, in a peaceful environment, to learn three key items that I didn’t learn in 10 minutes under duress and pressure yesterday.
Are you being fair to yourself by making time to learn? Do you read the whole book cover to cover, or just dip in for what you need today? What is the best balance?
Comments and questions are always welcome.
