One of the common tools we use when debugging code is a simple print statement. Just a way to tell the outside world what is going on. They are really good if you want to get a big-picture overview of what your code is doing. They are a great help and an embedded engineer’s most dreaded foe.
printf("My code just did %s, and got the result 0x%02s\n",
       _function_,
       answer);
I just want to share one of the ways this will trip you up.
Today, I was playing with an Arduino project, learning how their libraries work, porting the C code in my sketch into C++ code that I could share among a few Sketches in the same Sketchbook. Naturally, so that I could see when I was calling the library function versus the original code I had sprinkled in some printfs.
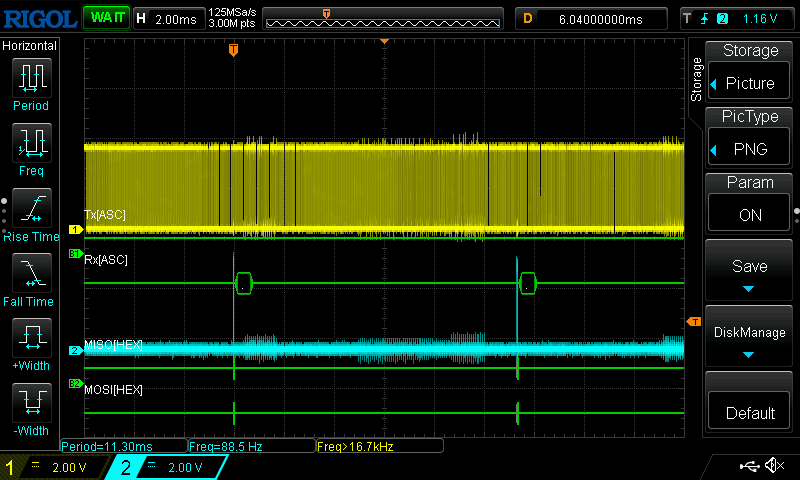
Why are my SPI transactions so far apart?
The library, actually wrote itself; well Co-Pilot saw what I was thinking and filled in the blanks. Co-Pilot, I always say, is like having an eager junior programmer helping me. Their code is mostly solid, but they make assumptions, don’t fully read the specs, and make innocent mistakes.
Today’s Co-pilot mistake was to use the default pins for the SPI port and not the ones I’d configured for my setup. I saw it in the code review and wanted to make sure I hadn’t miss understood some Arduino idiom. I instrumented my code and had a poke around. I fixed the port assignment, but then I noticed that the gap between two back-to-back SPI writes was a silly long gap.
Before you ask – Rigol DS1202Z-e. It’s only 2 channels but a 200MHz scope. If I need wider busses monitoring, well, I have a Saleae Pro 16 sitting there, but for a quick look at signals (especially repeated signals) and high frequency, the scope does the job as well or better than the LA (logic analyzer).
I knew the problem, and thought, “This is a great teaching moment!”
I left probe 2 triggering on SCLK . You can see where the blue edges are, and the lower green is the decode (canned functions in a 3-year-old scope, so MIOS/MOSI, not POCI/PICO), you can see where clocked data was decoded. As for probe 1? I moved that to my debug serial monitor port.
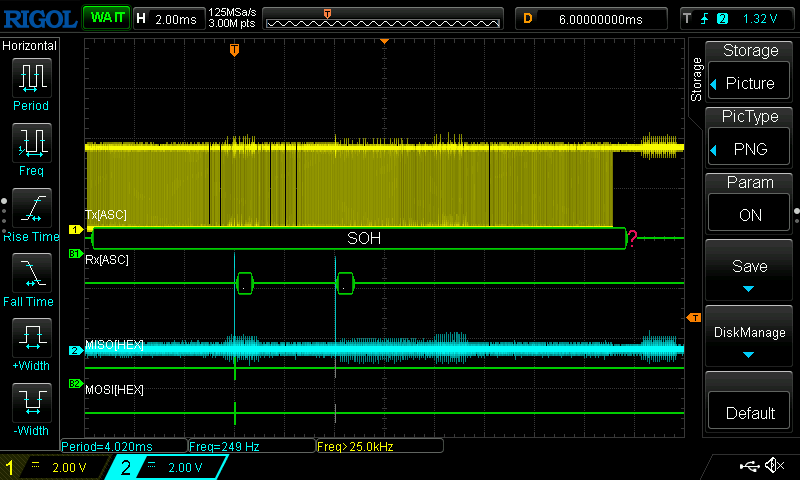
Cleaning out extra printf() commands
I moved the yellow probe to the board’s UART TX pin so we can see if indeed the Serial Monitor printf()s were the cause. Boy, is that a lot of activity. Co-pilot likes to make verbose prints, and the Arduino IDE serial monitor was set at 9600 baud to make things worse.
void cc1101::spi_command_strobe(uint8_t strobeCommand)
{
printf("cc1101::spi_command_strobe(uint8_t strobeCommand)\n");
uint8_t radio_status = spi_transfer_byte(strobeCommand);
printf("cc1101::spi_command_strobe(uint8_t strobeCommand) -> 0x%02x\n\tradio status -> 0x%02x\n", strobeCommand, radio_status);
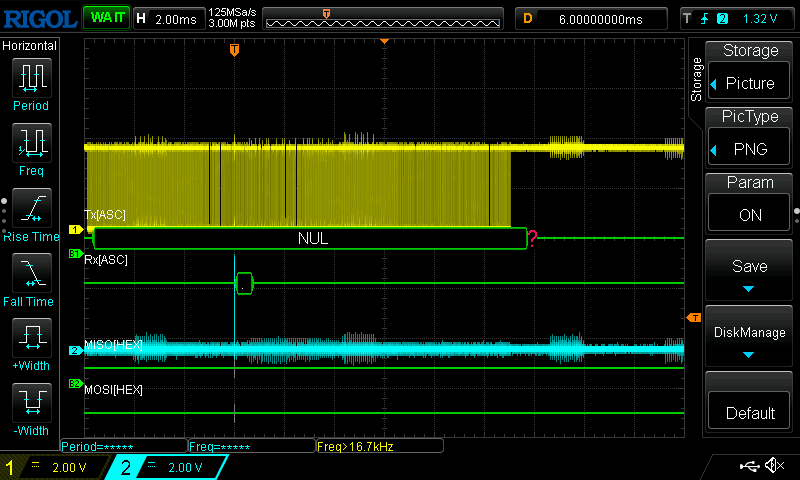
}I pulled out the prints in the upper layer code and saw the SPI transactions move closer together.
So I looked at the lower level. Yup, I had prints in there too, removing them, well I had to zoom in to confirm I had two SPI transactions still.
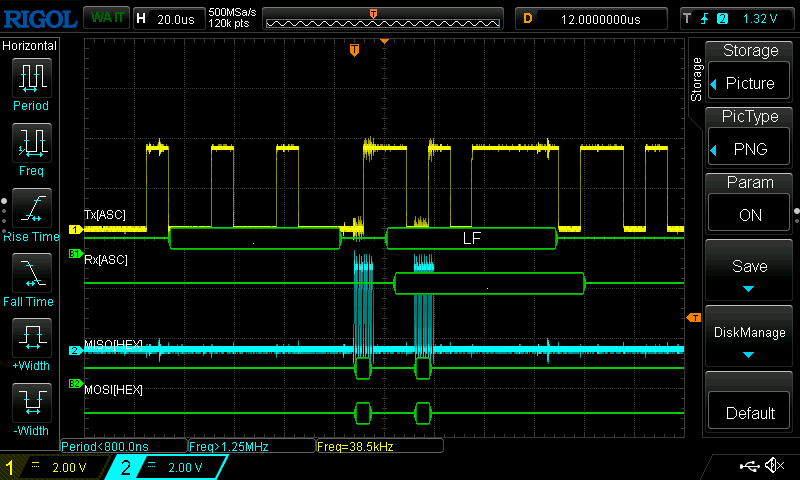
Can you imagine if there was anything time critical going on here? We just reduced an 11ms interval taken up with debug output, down to about 20us.
Now you can see why you should never put a print in an ISR (interrupt service routine). Any critical timing will be messed up with slow, long prints even outside an ISR.
Better ways to observe your codes behavior
There are alternatives.
- Logging system
- SW controlled GPIO (general purpose input/output) debug test point
If you had a proper logging system that would use a block copy, then a background task would drive the UART with a log record. Sure, that means your logs will no longer appear on your PC right after the action happens, and if your system crashes before the buffer is output, well, you will think the print never occurred, and you’ll be looking for the failure in the wrong part of your code.
You could use a GPIO output. In my case, I would want two GPIOs, one for each function I was comparing. You assert the GPIO pin as you enter the function and clear it after. My system is a little constrained in spare GPIOs, and my scope, as discussed, is only a 2-channel device. The Saleae is in its bag, so it is 15 minutes from being usable. That’s why I lazily used the prints, and with Co-Pilot filling out the line after I type “pri” it is too easy to do.
The GPIO will always be less invasive than the logging. If you know what you are doing, on some systems it can be done with a LD, OR, ST to set and a LD, AND, ST to clear. That is three assembly code instructions, “Load from memory to register”, “OR immediate to register”, and “Store register to memory”. However, you do need an oscilloscope and some spare IO pins brought out to an observable point on the board.
Conclusions
Don’t stop using your print statements. They have great value, and on a fast enough machine not running the most time-critical code they are one of the better solutions, without complexity, or onerous requirements.
If you can use a logging system, it will give you more reliable on-time performance. This comes at the cost of RAM space to buffer the messages. It has the hidden peril of leading you astray if the log is written, but never output. You might be able to use the debugger to check for pending messages in RAM, but that requires understanding of the loggers internals.
GPIO’s are the go-to instrumentation of old-school embedded engineers. We like them; we see them toggle in real time around other board activities. Unfortunately they require a scope or LA to see them. They are free if you have enough spare GPIOs, but once all the pins are in use for essential peripherals, you have no debug visibility.

Just stating the obvious – printf() is never good for debugging race condition bugs.
Logging might not work in this case if the log you’re using would introduce delays to the race bug.
LikeLiked by 1 person
“Having just dealt with the issues of using printf, I now understand why it’s important to be careful with it.”
LikeLiked by 1 person